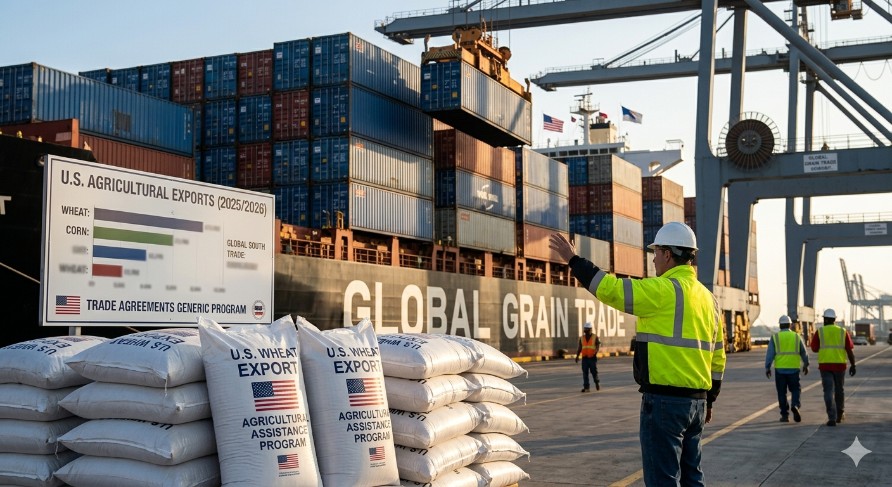
Food Economics: U.S. Policy, Trade, and Global Hunger
Imagine walking through your local grocery store and noticing that the price of wheat bread has jumped fifty cents in one month. You might blame the weather or the farmer, but the real driver could be currency fluctuations or energy spikes happening thousands of miles away. This is the core of food economics—the intersection where agricultural markets meet macroeconomic policy, determining whether food reaches your plate affordably.
Defining Food Economics: Macro Channels and Food Security Dimensions
Economists define food security through four dimensions [established by the Food and Agriculture Organization of the United Nations (FAO)]: availability, access, utilization, and stability. Availability asks whether sufficient food exists in aggregate. Access examines whether households possess the resources to obtain it. Utilization considers nutritional absorption and food safety. Stability guarantees these three dimensions persist over time without disruption from economic or climatic shocks.
The USDA Economic Research Service (ERS) identifies six macro channels that transmit economic conditions to hunger outcomes. These include exchange rates, trade flows, income growth, employment levels, interest rates, and energy costs. When the dollar strengthens against other currencies, U.S. exports become more expensive abroad, reducing demand while potentially lowering domestic prices. When energy costs rise, fertilizer prices follow within months, squeezing farm margins and eventually reaching consumer prices as food inflation.
Understanding these linkages matters because global food systems now operate in an interconnected web where a interest rate hike in Washington or an energy spike in Europe can trigger price volatility in rural markets worldwide. The Global Agricultural Productivity Initiative emphasizes that total factor productivity (TFP)—the efficiency of converting inputs into outputs—sits at the center of these debates. Yet macroeconomic conditions determine whether productivity gains actually reach hungry populations or remain trapped in supply chains.
You feel these effects directly when macroeconomic instability shrinks your purchasing power or limits options at the supermarket. A family in the Midwest might cut back on protein when fertilizer costs spike, while a household in Mumbai faces higher import bills when the rupee depreciates. These parallel struggles highlight why food economics requires analyzing both farm-level decisions and central bank policies simultaneously.
How Macroeconomic Policy Transmits to Farm Production and Food Prices
Macroeconomic policy transmits to farm production and food prices through distinct channels that affect your grocery bill. The USDA ERS Agricultural Exchange Rate Data Set tracks nominal and real rates across 79 countries plus the EU, revealing how currency movements alter trade competitiveness overnight. When a nation’s currency appreciates, its agricultural exports become more expensive on world markets, reducing demand for American soybeans or corn while making imports cheaper for domestic consumers.
These transmission mechanisms create ripple effects that reach your community regardless of local growing conditions. When the Federal Reserve raises rates to combat inflation, the dollar strengthens, making U.S. wheat less competitive against Russian or Australian exports. Farmers respond by cutting planting acreage, which reduces supply and eventually raises bread prices. Meanwhile, higher rates increase mortgage and credit costs for farm operations, forcing sales of equipment that won’t be replaced for years, embedding scarcity into future harvests.
Interest rates drive farm investment decisions through borrowing costs. When rates rise, farmers delay equipment purchases and reduce input applications, lowering yields in subsequent seasons. The USDA International Macroeconomic Data Set covers 189 countries representing over 99% of the world economy, showing how synchronized rate hikes across major economies can depress global agricultural investment simultaneously.
Energy costs transmit directly to food inflation through fertilizer and fuel prices. Natural gas comprises the majority of nitrogen fertilizer production costs, so when oil and gas markets spike, corn and wheat prices follow within one production cycle. Income and employment levels determine food demand elasticity—when recessions hit, consumers shift toward staples and away from livestock products, altering farm revenue across sectors.
Exchange Rates and Agricultural Trade Competitiveness
Exchange rates create immediate winners and losers in agricultural markets. The ERS dataset distinguishes between nominal rates—actual currency conversion values—and real rates adjusted for inflation differentials. Since 1970, quarterly updates have tracked how a 10% dollar appreciation typically reduces U.S. agricultural export volumes within twelve months. Currency depreciation offers the reverse benefit: when the yen weakens, Japanese beef imports become cheaper for consumers, increasing demand for American ranchers while potentially undermining domestic producers.
Input Intensification vs. Productivity: Explaining Agricultural Wealth Gaps
The gap between rich and poor countries’ agricultural output stems less from efficiency differences than from input intensity. According to Penn State University’s 2022 research, capital deepening and intermediate-input intensification account for roughly two-thirds of the agricultural labor-productivity gap between the richest and poorest nations. This finding upends conventional wisdom suggesting that poor countries simply need better technology or seeds.
In reality, agricultural total factor productivity (TFP)—the efficiency with which inputs become outputs—often runs similar across middle- and high-income countries. The divergence arises because wealthy nations deploy vastly more capital and intermediate inputs per worker. A corn farmer in Iowa uses GPS-guided tractors, precision irrigation, and automated processing, while a counterpart in Sub-Saharan Africa may rely on hand tools and rainfall. The Iowa farmer produces significantly more per hour not because she works harder or smarter, but because she commands more machinery and fertilizer.
This distinction matters for economic development and hunger reduction. If TFP gaps are narrow, then policies focusing solely on research and development miss the primary constraint: capital accumulation and input access. The Global Agricultural Productivity Initiative confirms that non-agricultural TFP differences—the productivity of manufacturing and services—actually drive national income inequality more powerfully than agricultural efficiency gaps. When cities generate wealth, they create demand that lifts rural wages and investment, indirectly solving food access problems.
Does agricultural productivity growth reduce hunger, or does distribution matter more? The Penn State evidence suggests both matter, but distribution of inputs dominates efficiency improvements. You can have high-yielding seeds, but without fertilizer, irrigation, and machinery, they fail to close wealth gaps. Conversely, nations that have pushed capital into agriculture—like South Korea and Taiwan during their development phases—saw labor productivity surge even with modest TFP improvements, pulling millions from poverty.
Consider the contrast between Argentina and South Korea circa 1960. Both had agricultural sectors employing large portions of their populations. South Korea pursued policies that channeled capital into rural mechanization while stabilizing prices. Argentina prioritized macroeconomic stability less consistently. Over six decades, South Korean agricultural labor productivity rose fifteen-fold, not because farmers became inherently more efficient, but because they gained access to tractors, refrigerated storage, and chemical inputs. Argentina’s productivity languished despite similar natural endowments. This historical divergence illustrates why wealth inequality persists across agricultural regions and why simply sending better seeds to poor countries cannot bridge the gap without accompanying capital investment.
The USDA ERS report ERR-46 on global growth and trade reinforces these findings, showing that macroeconomic conditions enabling capital formation matter as much as agricultural policy itself. When interest rates stay stable and exchange rates predictable, farmers invest in the equipment that creates true productivity divergence between rich and poor regions.
Agrifood Trade and Nutrition: Balancing Diversity with Price Stability
International agrifood trade has emerged as both a lifeline and a complexity for global nutrition. [According to the most recent OECD-FAO Agricultural Outlook, global food and agricultural trade reached a record USD 1.9 trillion in value during 2021], with calories traded more than doubling since 2000. This expansion means your diet relies on producers across dozens of countries, creating resilience through diversity but vulnerability to distant shocks.
Trade fundamentally expands diet diversity. The OECD-FAO data shows that importing countries now access an average of 225 distinct food items, compared to only 120 that could be produced domestically. This variety improves micronutrient availability, reducing deficiency diseases that plagued isolated populations. When typhoons destroy rice crops in Southeast Asia, global trade allows consumers to switch to wheat or maize from other regions, preventing famines that once killed millions.
Can trade stabilize food prices during shocks? Generally yes, though the effect varies by commodity. During the 2022 energy crisis, global grain trade flows redirected surplus from India and Australia to deficit regions in North Africa, capping price spikes despite regional droughts. However, trade also transmits volatility. When major exporters impose export bans to protect domestic consumers, as happened with wheat and rice in 2008 and 2022, world prices spike immediately, harming import-dependent poor countries most severely.
The trade-nutrition relationship carries complexity beyond calorie counts. Highly processed trade goods often displace traditional diets, creating obesity alongside food security. Yet trade in fresh fruits, seafood, and fortified grains provides nutritional benefits impossible through domestic production alone. The World Bank Food Security Update notes that nations with open agrifood trade regimes show lower price volatility than autarkic economies, though they require foreign currency reserves to manage import bills during currency crises.
You experience this balance when buying avocados in January or salmon far from the coast. These items arrive through trade networks that stabilize prices by arbitraging surpluses across hemispheres. But when the dollar strengthens suddenly, those same networks raise prices for importing nations, forcing families to abandon diverse diets for carbohydrate staples. The global food systems that deliver morning coffee and afternoon chocolate rely on exchange rate stability explored in USDA ERS macro datasets, reminding us that trade openness requires macroeconomic management to deliver nutritional security.
Regional Disparities: When Food Availability Doesn’t Equal Access
Global food availability has improved over two decades, yet access remains starkly unequal across regions. [A prominent 2023 study in Nature Food analyzing 170 countries using a similar framework] reveals severe imbalances. North America, East Asia, and Europe demonstrate high food security performance across all dimensions. Sub-Saharan Africa and South Asia face severe deficits despite significant production increases.
South America presents a telling case study. The region has improved food availability and utilization through technological adoption and land expansion. However, persistent poverty and food access struggles remain, with millions unable to afford adequate calories despite regional surpluses. This disparity explains why some regions remain food-insecure despite higher aggregate output. Availability—the physical presence of food—does not automatically create access, which requires purchasing power and distribution infrastructure.
Wealth gaps translate into nutritional outcomes through market segmentation. High-income neighborhoods enjoy diverse, fresh markets while poor regions rely on calorie-dense, nutrient-poor staples. The World Bank Food Security Update confirms that income inequality predicts undernourishment rates more accurately than national calorie availability. When economic growth concentrates in urban service sectors without reaching rural agricultural workers, food availability rises nationally while nutritional status stagnates in vulnerable populations.
Consider India and the United States. Both produce sufficient calories to feed their populations several times over. Yet India reports higher rates of child malnutrition than the U.S. despite lower obesity rates. The difference lies in access pathways. American food assistance programs reach millions monthly through electronic benefit cards accepted at most retailers. Indian distribution networks, while improving, still suffer from leakage, spoilage, and exclusion errors that deny access to those technically eligible. These operational failures persist even when macroeconomic conditions favor agricultural growth, illustrating why wealth inequality creates divergent nutritional outcomes despite global output growth. [When analysts examine these patterns, they find] that macroeconomic stability enables but does not guarantee food access without micro-level delivery mechanisms.
The Policy Design-Implementation Gap
The Nature study identifies a persistent gap between policy design and implementation, particularly severe in Sub-Saharan Africa and South Asia. The PSRI framework—tracking pressure, state, response, and impact—reveals where macroeconomic policies fail to reach ground-level food access. Governments may set price controls or subsidies, but without foreign currency to import fertilizer or fuel for distribution, these policies remain paper promises. This implementation gap represents the primary barrier to converting economic growth into food security.
U.S. Agricultural Policy and Global Market Influence
U.S. agricultural policy shapes global markets through specific levers that influence your food costs worldwide. The USDA Agricultural Baseline Projections—released each February—provide a ten-year outlook for the farm sector, signaling planting intentions that affect global commodity prices. When these projections predict high corn acreage, ethanol markets and livestock feeders adjust worldwide, creating ripple effects before seeds even enter soil.
U.S. macro conditions transmit through trade volumes analyzed in USDA ERS report ERR-46. This report establishes that global economic growth rates and exchange rate fluctuations explain significant variance in American agricultural export competitiveness. When the U.S. economy grows steadily without excessive inflation, consumer demand for premium imports rises, but simultaneous dollar strength can choke export volumes, creating trade deficits that pressure farm prices.
The specific datasets available for macro-agriculture analysis include the ERS Agricultural Exchange Rate Data Set and International Macroeconomic Data Set, covering 189 countries and over 99% of the world economy. These tools allow analysts to model how Federal Reserve interest rate decisions influence Brazilian soybean planting or Chinese pork imports. You can track these relationships through the USDA ERS Macroeconomics & Agriculture portal, which updates quarterly indicators affecting farm production decisions.
These policy levers matter for economic development and hunger beyond American borders. When the U.S. maintains stable macroeconomic conditions, it provides a reliable market for agricultural exports from developing nations, enabling those countries to generate foreign currency for their own food imports. Conversely, volatile American interest rates or tariff shifts—such as sudden steel tariffs that raise farm equipment costs—can destabilize planting decisions in regions dependent on U.S. machinery. The ten-year baseline projections serve as coordination devices for global supply chains, allowing traders from Buenos Aires to Bangkok to hedge future production, stabilizing availability even when local conditions deteriorate.
Tracking Hunger in Real Time: Data Sources and Dashboards
Monitoring global hunger requires real-time data that captures climate shocks, trade disruptions, and macroeconomic shifts simultaneously. The World Bank Food Security Update—[which is updated regularly]—provides quarterly assessments tracking these intersections. Their portfolio spans 90 countries, with interventions expected to benefit 327 million people by 2030, offering concrete metrics for food security challenges.
[The Global Food and Nutrition Security Dashboard—developed by the Global Alliance for Food Security, which was co-convened by the G7 and World Bank in May 2022]—aggregates data from multiple sources including satellite crop monitoring and price feeds. You can combine these global monitoring systems with USDA ERS macro datasets to analyze how exchange rate volatility predicts import shortfalls in real time.
When climate shocks interact with trade restrictions, these dashboards flag emerging risks before they become famines. The Global Agricultural Productivity Initiative highlights a troubling trend within these data: global agricultural TFP growth has slowed to 0.7 percent annually, far below the 2 percent target needed to feed 10 billion people by 2050. This productivity slowdown, visible in dashboard trend lines, threatens to undo poverty and food access gains unless reversed through accelerated innovation and capital investment.
You can leverage these tools to anticipate local impacts. When the dashboard shows drought conditions developing in Argentina alongside currency devaluation, you can predict soy price spikes that will reach American poultry farms within months. Similarly, when TFP indicators stagnate in Sub-Saharan Africa while populations grow, the gap signals future migration pressures and import demands that will reshape global food systems. These monitoring frameworks allow policymakers to move beyond reactive crisis response toward preventive macroeconomic management, stabilizing food access before shocks trigger widespread hunger.
Conclusion: Bridging Macro Analysis and Food Security Solutions
Bridging macro analysis and food security solutions requires recognizing that input intensification matters as much as TFP for closing wealth gaps. The evidence from Penn State and USDA shows that capital accumulation and intermediate inputs drive agricultural labor productivity, not just efficiency improvements. Without tractors, irrigation, and fertilizer, the best seeds fail to generate surpluses that reduce hunger.
Trade expands access but requires stable macro conditions to function as a safety net. When exchange rates swing wildly or energy costs spike, trade channels constrict, leaving import-dependent regions vulnerable. The regional disparities identified in Nature’s PSRI analysis persist because policy design-implementation gaps undermine macroeconomic stability at the local level. A perfectly designed subsidy fails when currency crises prevent fertilizer imports.
Food economics demands coordination between agricultural policy and broader macroeconomic stability. You cannot solve global hunger through farm subsidies alone while ignoring interest rate policies that determine equipment investment or exchange rate regimes that govern trade competitiveness. The U.S. data infrastructure—combining Agricultural Baseline Projections with real-time exchange rate tracking—offers a model for evidence-based hunger reduction that other regions can adapt. By integrating these datasets into platforms like the Global Food and Nutrition Security Dashboard, policymakers finally possess the tools to align macroeconomic conditions with ground-level food access, turning economic growth into nutritional reality.
This integrated approach addresses why policy design often fails in practice—macroeconomic shocks disrupt implementation before local programs can deploy. When inflation or currency crises hit, governments abandon nutrition programs to stabilize banks, leaving vulnerable populations without access despite policy promises. True food security emerges only when macroeconomic management prioritizes stability specifically to protect agricultural investment and trade flows.